
This tutorial will show how the MiCADO 0.1.0/A [outdated] version works with a Docker Swarm cluster. With this solution applications can automatically scale without user intervention in a predefined scaling range to guarantee that the application always runs at the optimum level of resources.
The tutorial builds a scalable architecture framework with the help of Occopus and performs the automatic scaling of the application based on Occopus and Prometheus (a monitoring tool). The scalable architecture framework can be seen in Figure 1.
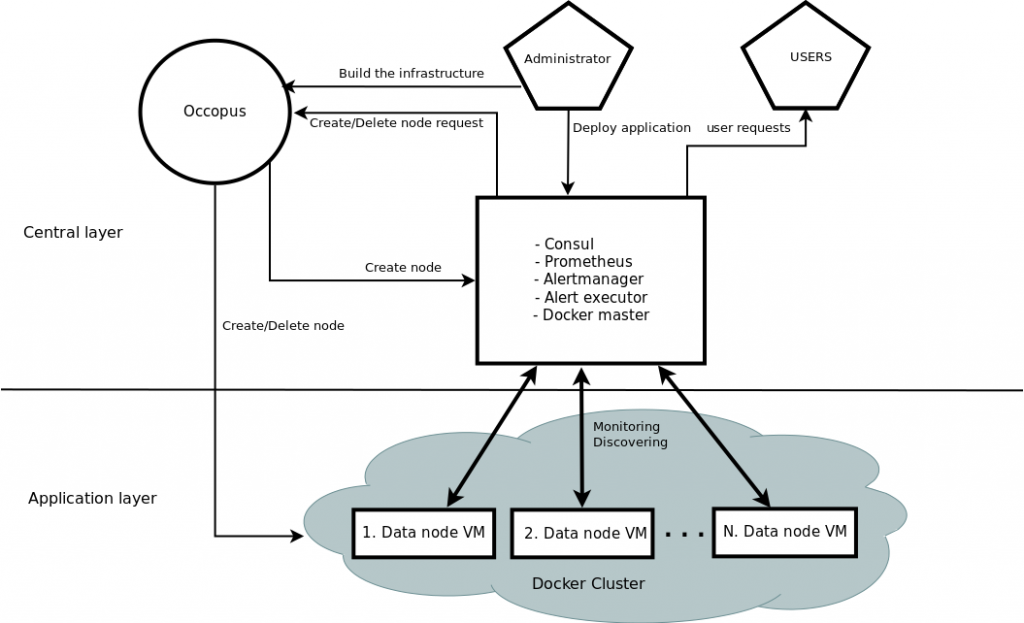
Figure 1. Docker based auto-scaling infrastructure with Swarm’s built in load balancer
The scalable architecture framework consists of the following services:
- Cloud orchestrator and manager: Occopus
- Application node: Data Avenue (DA)
- Service discovery: Consul
- Load balancer: Swarm
- Monitor: Prometheus
In this infrastructure you will see how can you create a global service in Docker Swarm. When it is started every Docker node in the Swarm cluster will run a replica from this service, which is simply the application you want to scale. Docker Swarm will take care of the load balancing activity to direct user requests to the application. In this infrastructure nodes are discovered by Consul, which is a service discovery tool also providing DNS service and are monitored by Prometheus, a monitoring software. Prometheus supports alert definitions which later will help you write custom scaling events.
In this demonstration architecture, the Data Avenue (DA) service was selected to be the concrete application. Notice that other applications can easily replace the DA service and by changing the concrete application. The DA service here implements data transfer between the client and a remote storage using various protocols (http, sftp, s3, …). For further details about the software, please visit the Data Avenue website. Finally, in the lowest layer there is a Database node (not shown in Figure 1) required by the instances of Data Avenue to store and retrieve information (authentication, statistics) for their operation.
The monitor service Prometheus collects runtime information about virtual machines running the Docker based application (DA). These VMs are connected to Docker Swarm. If the VM that runs the DA Docker service are overloaded, Prometheus instructs Occopus to scale up the number virtual machines in the Swarm cluster. Application containers can use all the hosts resources so monitoring the virtual machine resources is enough and we don’t need container level monitoring. When Occopus scales up the cluster, the new VM will be attached and configured the same way as it was done for the previously deployed application node which consists of starting automatically the Docker based DA service ( 1 application container/ one virtual machine without restriction of the resources). If the DA services are underloaded Prometheus instructs Occopus to scale down the number of VMs which way all the containers on the node will be removed too. (In fact, the same scale up and down operations can be applied for the load balancer services, too.)
Advantages of Docker
- encapsulation
- shorter node description files
- easier maintenance
- OS independent
The biggest advantage of Docker Swarm what we will see, is that changing user application now easier than in V0/B. Users don’t have to modify the node description files at all. After logging in the virtual machine which is running Docker Swarm, you can start your own Docker service in one command.
Features
- using Prometheus to monitor nodes and create user-defined scaling events
- using load balancers to share system load between application nodes
- using Consul as a DNS service discovery agent
- using application nodes running the application
Prerequisites
- accessing a cloud through an Occopus-compatible interface (e.g. EC2, OCCI, Nova, etc.)
- target cloud contains a base 16.04 ubuntu OS image with cloud-init support (image id, instance type), for ‘db’ node use 14.04 ubuntu OS image with cloud-init support.
- start Occopus in Rest-API mode ( Occopus-rest-service )
Download:
You can download the base project files:
Steps
Open the file nodes/node_definitions.yaml and edit the resource section of the nodes labelled by node_def:
-
- you must select an Occopus compatible resource plugin
- you can find and specify the relevant: list of attributes for the plugin
- you may follow the help on collecting the values of the attributes for the plugin
- you may find a resource template for the plugin in the resource plugin tutorials
The downloadable package for this example contains a resource template for the EC2 plugin.
- Edit the: infrastructure_descriptor.yaml infrastructure descriptor file. Set the following attributes:
- scaling is the interval in which the number of nodes can change (min, max). You can change app nodes or leave them as they are.
- &APP_cluster # Node Running your application
  name: app
  type: app
  scaling:
    min: 1
    max: 10
Important
Keep in mind that Occopus has to start at least one node from each node type to work properly! Also one instance will always run from all the node types.
- Optionally, edit the nodes/cloud_init_prometheus.yaml node descriptor file’s “Prometheus rules” section in case you want to implement new scaling rules. The actually implemented rules are working well and can be seen below.
- {infra_id} is a built in Occopus variable and every alert has to implement it in their Labels!
- “Node” should be set to app or lb depending on which type of node the alerts should work
loadbalacing_cpu_utilization = 100 - (avg (rate(node_cpu{group="loadbalancing_cluster",mode="idle"}[60s])) * 100)
application_cpu_utilization = 100 - (avg (rate(node_cpu{group="application_cluster",mode="idle"}[60s])) * 100)

ALERT application_overloaded
  IF application_cpu_utilization > 50
  FOR 1m
  LABELS {alert="overloaded", cluster="application_cluster", node="da", infra_id="{{infra_id}}"}
  ANNOTATIONS {
  summary = " application cluster overloaded",
  description = " application cluster average CPU/RAM/HDD utilization is overloaded"}
ALERT application_underloaded
  IF application_cpu_utilization < 20
  FOR 2m
  LABELS {alert="underloaded", cluster="application_cluster", node="da", infra_id="{{infra_id}}"}
  ANNOTATIONS {
  summary = " application cluster underloaded",
  description = " application cluster average CPU/RAM/HDD utilization is underloaded"}
Important
Autoscaling events (scale up, scale down) are based on Prometheus rules which act as thresholds, let’s say scale up if cpu usage > 80%. In this example you can see the implementation of a cpu utilization in your app-lb cluster with some threshold values. Please, always use infra_id in you alerts as you can see below since Occopus will resolve this variable to your actual infrastructure id. If you are planning to write new alerts after you deployed your infrastructure, you can copy the same infrastructure id to the new one. Also make sure that the “node” property is set in the Labels subsection, too. For more information about Prometheus rules and alerts, please visit:https://prometheus.io/docs/alerting/rules/
- Edit the “variables” section of the infrastructure_descriptor.yaml file. Set the following attributes:
- Occopus_restservice_ip is the ip address of the host where you will start the Occopus-rest-service
- Occopus_restservice_port is the port you will bind the Occopus-rest-service to
Occopus_restservice_ip: "127.0.0.1"
Occopus_restservice_port: "5000"
- Components in the infrastructure connect to each other, therefore several port ranges must be opened for the VMs executing the components. Clouds implement port opening various way (e.g. security groups for OpenStack, etc.). Make sure you implement port opening in your cloud for the following port ranges:
TCP 22 (SSH)
TCP 80 (HTTP)
TCP 443 (HTTPS)
TCP 8300 (Consul) TCP Server RPC. This is used by servers to handle incoming requests from other agents.
TCP and UDP 8301 (Consul) This is used to handle gossip in the LAN. Required by all agents.
TCP and UDP 8302 (Consul) This is used by servers to gossip over the WAN to other servers.
TCP 8400 (Consul) CLI RPC. This is used by all agents to handle RPC from the CLI.
TCP 8500 (Consul) HTTP API. This is used by clients to talk to the HTTP API.
TCP and UDP 8600 (Consul) DNS Interface. Used to resolve DNS queries.
TCP 9090 (Prometheus)
TCP 8080 (Data Avenue)
TCP 9093 (Alertmanager)
- Make sure your authentication information is set correctly in your authentication file. You must set your authentication data for the resource you would like to use. Setting authentication information is described here.
- Load the definitions into the database.
Important
Occopus takes node definitions from its database when builds up the infrastructure, so importing is necessary whenever the node definition or any imported (e.g. contextualisation) file changes!
Occopus-import nodes/node_definitions.yaml
- Start Occopus in REST service mode:
Occopus-rest-service --host [Occopus_restservice_ip] --port [Occopus_restservice_port]
Use ip and port values as defined in the infrastructure description! Alternatively, use 0.0.0.0 for the host ip.
- Start deploying the infrastructure through the Occopus service:
curl -X POST http://[Occopus_restservice_ip]:[Occopus_restservice_port]/infrastructures/ --data-binary @infrastructure_descriptor.yaml
- Start the application.The infrastructure itself won’t start any application just connect the nodes and configure them. To start the example DA or implement your own application follow these steps. First you have to ssh into the VM that runs Docker Swarm which node called Prometheus.After you logged in, you have to start the application as a global Docker service. Global mode means that every node in the Swarm cluster will run one and only one replica of the specified Docker image. To start the service type the following command. Look for the placeholder!To start the example Data avenue application (requires sudo privileges!):
docker service create --name DA --mode global --publish 80:8080 -e IP=[DB ip address] -p 8080:8080 rabotond/avenue
- “–name”: gives a name to the service which you will find in all the nodes in the Swarm cluster
- “– mode” global: runs the Docker image in every node in the Docker cluster
- “– publish” [port]: routes http requests to the applications
- “–e” IP=[SQL ip]: points the example DA application containers to the database node
- “–p”: expose container ports to host ports
- rabotond/avenue: name of the image
To start your own application (requires sudo privileges!):
docker service create --name [name_of_the_application] --mode global --publish [port_number_where_your_application_listen]:[port_on_which_you_want_to_reach_it] -p [host_port]:[container_port] [docker_image]
What you have to keep in mind that Docker containers have a separate network, and you should make sure that you expose the ports on which your application is listening to the virtual machine port. Otherwise you won’t be able to reach your running application.
Note:To expose container ports use the “-p [host port]:[container port]” as in the above command
After you started you global service, Docker Swarm will share the load in the Swarm cluster by creating a routing mash. It is created automatically, when you specified the “–publish” argument.
Note:You can find more info about Docker’s built in load balancer in the following link: https://docs.Docker.com/engine/swarm/ingress/
Note:For detailed explanation on cloud-init and its usage, please read the cloud-init documentation!
To query the running services and the available nodes in the Swarm cluster run (requires sudo privileges!):
docker service list
docker node ls
- To test the down-scaling mechanism scale up manually the application nodes first through the Occopus REST interface and after a few minutes you can observe that the newly connected nodes will be automatically removed because the underloaded alert is firing. You can also check the status of your alerts during the testing at [PrometheusIP]:9090/alerts.
curl -X POST http://[Occopus_restservice_ip]:[Occopus_restservice_port]/infrastructures/[infrastructure_id]/scaleup/app
Important
Depending on the cloud you are using for you virtual machines it can take a few minutes to start a new node and connect it to your infrastructure. The connected nodes are present on prometheus’s Targets page.
- To test the scaling mechanisms with the example DA application, put some load on the infrastructure with the command below. To do so, just pick one of the virtual machine’s IP address and generate load on it with running the command below in a few copy ~10. Because all the nodes are connected to a Swarm cluster it will automatically proxy user requests to one of the nodes in the cluster as you can see in figure 2. This is the so called routing mash of Docker.
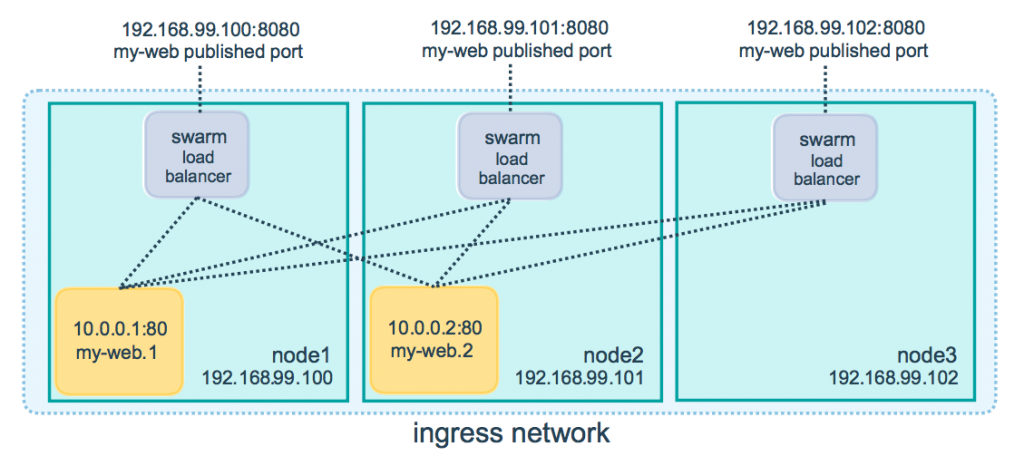
Figure 2. Docker routing mash
After a few minutes the cluster will be overloaded, and the overloaded alerts will fire in Prometheus. A new application node will be started and connected to the Swarm cluster. Also, if you stop sending files for a while, the underloaded alerts will fire in Prometheus and one (or more) of the application nodes will be shut (scaled) down.
To query the nodes and their IP addresses, use this command:
curl -X GET http://[Occopus_restservice_ip]:[Occopus_restservice_port]/infrastructures/[infrastructure_id]
Once, you have the ip of the selected node, generate load on it by transferring a 1GB file using the command below. Do not forget to update the placeholder!
curl -k -o /dev/null -H "X-Key: 1a7e159a-ffd8-49c8-8b40-549870c70e73" -H "X-URI:https://autoscale.s3.lpds.sztaki.hu/files_for_autoscale/1GB.dat" http://[any of the node ip addresses]/blacktop3/rest/file
To check the status of alerts under Prometheus during the testing, keep watching the following url in your browser:
http://[prometheus node ip]:9090/alerts
Important
Depending on the cloud you are using for you virtual machines it can take a few minutes to start a new node and connect it to your infrastructure. The connected nodes are present on prometheus’s Targets page.
- Finally, you may destroy the infrastructure using the infrastructure id.
curl -X DELETE http://[Occopus_restservice_ip]:[Occopus_restservice_port]/infrastructures/[infra id]